Show code cell source
%load_ext watermark
import datetime as dt
import pandas as pd
import numpy as np
from scipy import stats


import IPython
from PIL import Image as PILImage
from IPython.display import Markdown as md
from IPython.display import display
from myst_nb import glue

# code descriptions
dfCodes = pd.read_csv("resources/codes_with_group_names_2015.csv")

# set the index of to codes
dfCodes.set_index("code", inplace=True)

# code description map
code_d_map = dfCodes.description

# code material map
code_m_map = dfCodes.material

pdtype = pd.core.frame.DataFrame
pstype = pd.core.series.Series

def scaleTheColumn(x):

    xmin = x.min()
    xmax = x.max()
    xscaled = (x-xmin)/(xmax-xmin)

    return xscaled

def rotateText(x):
    return 'writing-mode: vertical-lr; transform: rotate(-180deg);  padding:10px; margins:0; vertical-align: baseline;'

def cleanSurveyResults(data):
    # performs data cleaning operations on the
    # default data

    data['loc_date'] = list(zip(data.location, data["date"]))
    data['date'] = pd.to_datetime(data["date"])

    # get rid of microplastics
    mcr = data[data.groupname == "micro plastics (< 5mm)"].code.unique()

    # replace the bad code
    data.code = data.code.replace('G207', 'G208')
    data = data[~data.code.isin(mcr)]

    # walensee has no landuse values
    data = data[data.water_name_slug != 'walensee']

    return data

class SurveyResults:
    """Creates a dataframe from a valid filename. Assigns the column names and defines a list of
    codes and locations that can be used in the CodeData class.
    """

    file_name = 'resources/checked_sdata_eos_2020_21.csv'
    columns_to_keep=[
        'loc_date',
        'location',
        'river_bassin',
        'water_name_slug',
        'city',
        'w_t',
        'intersects',
        'code',
        'pcs_m',
        'quantity'
    ]

    def __init__(self, data: str = file_name, clean_data: bool = True, columns: list = columns_to_keep, w_t: str = None):
        self.dfx = pd.read_csv(data)
        self.df_results = None
        self.locations = None
        self.valid_codes = None
        self.clean_data = clean_data
        self.columns = columns
        self.w_t = w_t

    def validCodes(self):
        # creates a list of unique code values for the data set
        conditions = [
            isinstance(self.df_results, pdtype),
            "code" in self.df_results.columns
        ]

        if all(conditions):

            try:
                valid_codes = self.df_results.code.unique()
            except ValueError:
                print("There was an error retrieving the unique code names, self.df.code.unique() failed.")
                raise
            else:
                self.valid_codes = valid_codes


    def surveyResults(self):

        # if this method has been called already
        # return the result
        if self.df_results is not None:
            return self.df_results

        # for the default data self.clean data must be called
        if self.clean_data is True:
            fd = cleanSurveyResults(self.dfx)

        # if the data is clean then if can be used directly
        else:
            fd = self.dfx

        # filter the data by the variable w_t
        if self.w_t is not None:
            fd = fd[fd.w_t == self.w_t]

        # keep only the required columns
        if self.columns:
            fd = fd[self.columns]

        # assign the survey results to the class attribute
        self.df_results = fd

        # define the list of codes in this df
        self.validCodes()

        return self.df_results

    def surveyLocations(self):
        if self.locations is not None:
            return self.locations
        if self.df_results is not None:
            self.locations = self.dfResults.location.unique()
            return self.locations
        else:
            print("There is no survey data loaded")
            return None

# this defines the css rules for the note-book table displays
header_row = {'selector': 'th:nth-child(1)', 'props': f'background-color: #FFF;'}
even_rows = {"selector": 'tr:nth-child(even)', 'props': f'background-color: rgba(139, 69, 19, 0.08);'}
odd_rows = {'selector': 'tr:nth-child(odd)', 'props': 'background: #FFF;'}
table_font = {'selector': 'tr', 'props': 'font-size: 12px;'}
table_css_styles = [even_rows, odd_rows, table_font, header_row]

# collecting survey data
fdx = SurveyResults()
df = fdx.surveyResults()

# exclude the data from the walensee area
# inlcuding river samples
location_no_luse = [
    "linth_route9brucke",
    "seez_spennwiesenbrucke",
    "limmat_dietikon_keiserp",
    "seez"
]

city_no_luse = ["Walenstadt", "Weesen", "Glarus Nord", "Quarten"]

df = df[(~df.city.isin(city_no_luse))]
df = df[~df.location.isin(location_no_luse)]

# use the same criteria from the project results
codes = df[df.quantity > 20].code.unique()

# the intersect data
ind = pd.read_csv('resources/hex-3000m-cleaned/river-intersect-length.csv')

# merge the intersection data with the survey data
ints_and_data = df.merge(ind, on="location", how="outer")

# define the locations of interest
locations = df.location.unique()

data = ints_and_data[(ints_and_data.code.isin(codes)) & (ints_and_data.location.isin(locations))].copy()

# the number of intersects is from old map data
# it can be dropped for
data.drop("intersects", inplace=True, axis=1)

n_c_names = {
    "KLASSE": 'class',
    "NAMN": 'name',
    "BREITE": 'size',
    "water_name_slug":"feature",
}
data.rename(columns=n_c_names, inplace=True)
data.fillna(0, inplace=True)

def collectCorrelation(data, codes, columns):
    results = []
    for code in codes:
        d = data[data.code == code]
        dx = d.pcs_m.values
        for name in columns:
            dy = d[name].values
            c, p = stats.spearmanr(dx, dy)
            results.append({"code":code, "variable":name, "rho":c, "p":p})
    return results

def resultsDf(rhovals: pdtype = None, pvals: pdtype = None)-> pdtype:
    results_df = []
    for i, n in enumerate(pvals.index):
        arow_of_ps = pvals.iloc[i]
        p_fail = arow_of_ps[ arow_of_ps > 0.05]
        arow_of_rhos = rhovals.iloc[i]

        for label in p_fail.index:
            arow_of_rhos[label] = 0
        results_df.append(arow_of_rhos)

    return results_df

def styleBufferResults(buffer_results):
    buffer_results.columns.name = None
    bfr = buffer_results.style.format(precision=2).set_table_styles(table_css_styles)
    bfr = bfr.background_gradient(axis=None, vmin=buffer_results.min().min(), vmax=buffer_results.max().max(), cmap="coolwarm")
    bfr = bfr.applymap_index(rotateText, axis=1)

    return bfr

def countTheNumberOfCorrelationsPerBuffer(pvals: pdtype = None, rhovals: pdtype = None) -> (pdtype, pstype):

    # the number of times p <= 0.05
    number_p_less_than = (pvals <= 0.05).sum()
    number_p_less_than.name = "correlated"

    # the number of postive correlations
    number_pos = (rhovals > 0).sum()
    number_pos.name = "positive"

    # the number of negative correlations
    number_neg = (rhovals < 0).sum()
    number_neg.name = "negative"

    ncorrelated = pd.DataFrame([number_p_less_than, number_pos, number_neg])
    ncorrelated["total"] = ncorrelated.sum(axis=1)
    totals = ncorrelated.total

    return ncorrelated, totals

# this defines the css rules for the note-book table displays
header_row = {'selector': 'th:nth-child(1)', 'props': f'background-color: #FFF; text-align:right'}
even_rows = {"selector": 'tr:nth-child(even)', 'props': f'background-color: rgba(139, 69, 19, 0.08);'}
odd_rows = {'selector': 'tr:nth-child(odd)', 'props': 'background: #FFF;'}
table_font = {'selector': 'tr', 'props': 'font-size: 12px;'}
table_data = {'selector': 'td', 'props': 'padding: 6px;'}
table_css_styles = [even_rows, odd_rows, table_font, header_row]
2. Distance, size and class of rivers#
In the initial report and in the first section the influence of river inputs was quantitied by the number of river intersects within 1500 m of a survey location. With this method 13 possible correlations were identified, 11 positive and two negative. This method does not take into account the distance to the intersection, the length of the river section within the 1500 m buffer nor does it consider the size or class of the river. Here we consider those previously disregarded variables.
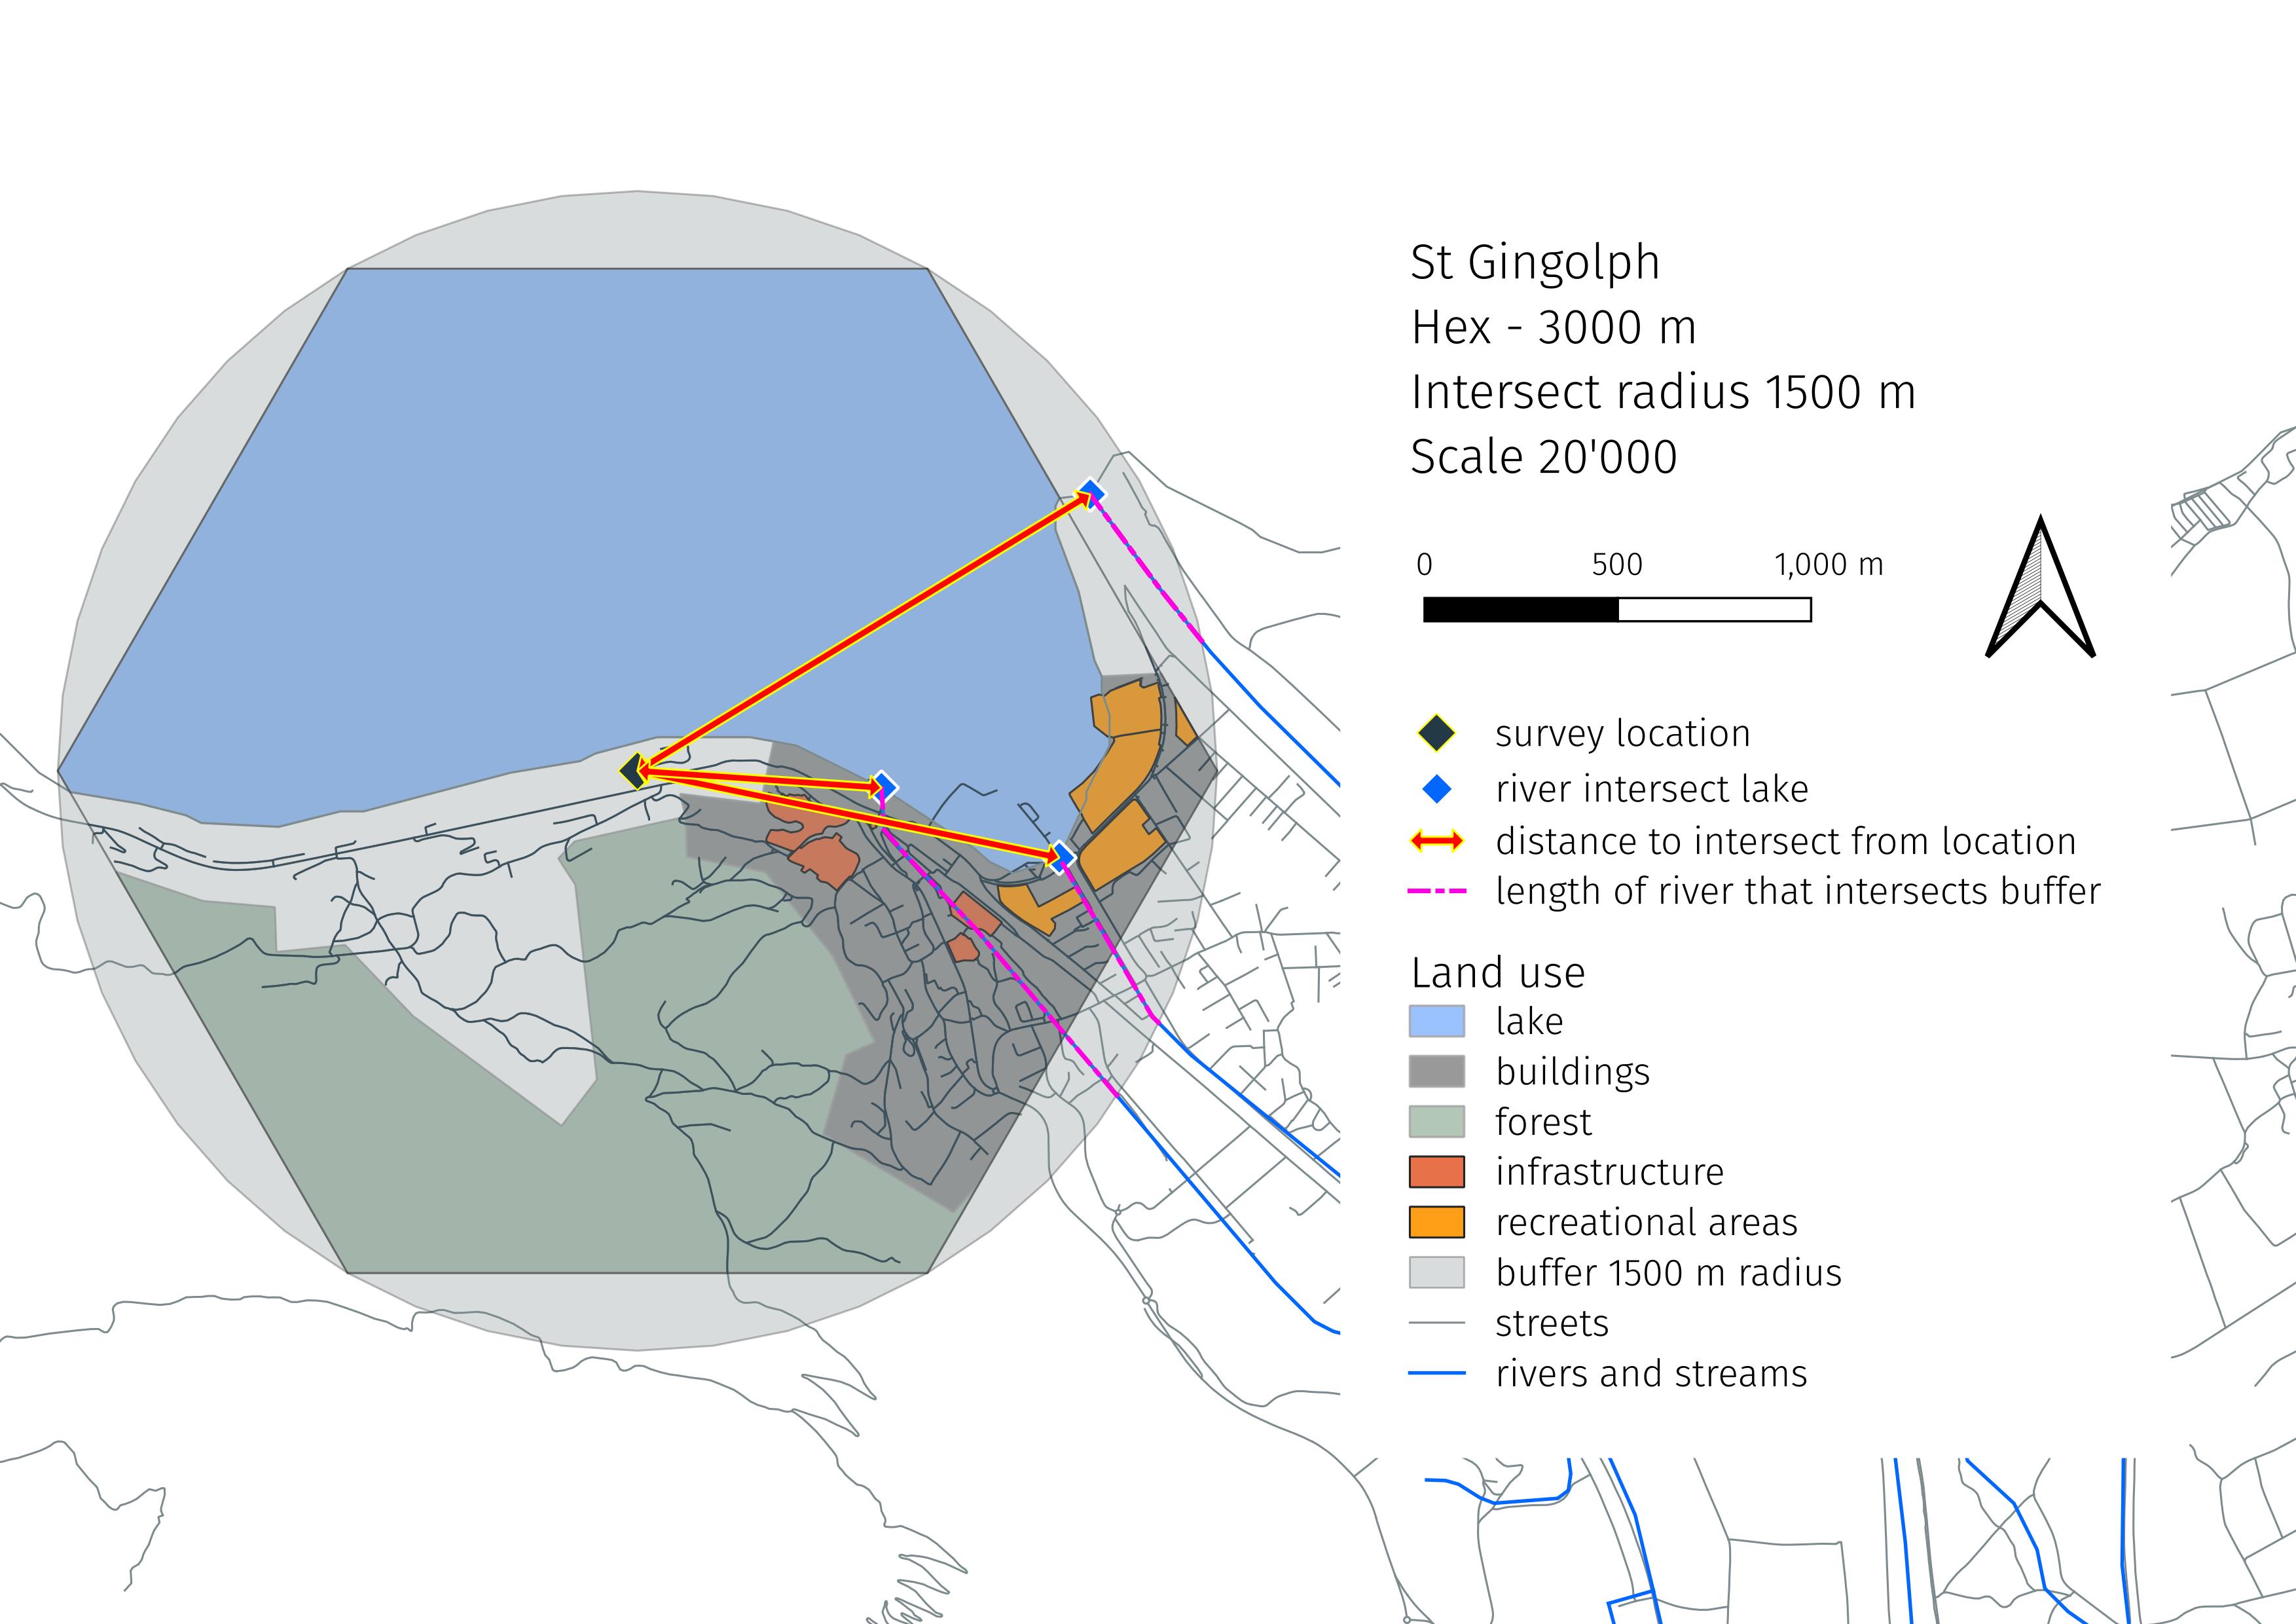
Fig. 2.1 #
figure 2.1: Measuring the distance to the intersection and length of the intersection in the buffer. Location: grand-clos, St. Gingolph - Lac Léman.
2.1. Extracting the values from the map layer#
The map layers that are publicly available have changed since the land-use attributes were originally considered for the project national survey. At that time we did not consider the length or distance. The size and the class of each river was not indicated on the previous map layers either. All that has changed:
There are fewer rivers and streams in the new map layers
Each river (section) is labled with the size, class, name and designated as man-made or natural.
To extract the required data for the analysis for each location and river the following steps were followed:
Identify locations of interest
Construct a buffer around each point
Mark the intersection of the river with the buffer and the lake
Calculate the length of the river section that traverses the buffer
Calculate the straight line distance from the survey location to the point where the river leaves the buffer and enters the lake
Most locations have more than one intersection. Which means that the survey result for a code is considered under all the possible conditions for each location. The results from St. Gingolph illustrate this:
| loc_date | location | river_bassin | feature | city | w_t | code | pcs_m | quantity | name | size | class | distance | length | |
|---|---|---|---|---|---|---|---|---|---|---|---|---|---|---|
| 32125 | ('grand-clos', '2020-05-07') | grand-clos | rhone | lac-leman | Saint-Gingolph | l | Gfrags | 2.56 | 82.00 | Canal Stockalper | 18.00 | 8.00 | 1114.31 | 498.26 |
| 32126 | ('grand-clos', '2020-05-07') | grand-clos | rhone | lac-leman | Saint-Gingolph | l | Gfrags | 2.56 | 82.00 | Le Rhône | 1.00 | 4.00 | 1372.53 | 475.23 |
| 32127 | ('grand-clos', '2020-05-07') | grand-clos | rhone | lac-leman | Saint-Gingolph | l | Gfrags | 2.56 | 82.00 | Le Tové | 10.00 | 10.00 | 632.92 | 1021.84 |
2.2. Testing the impacts of river inputs#
The method of aggregation leaves a few options for testing the impact of river inputs. Recall that there are river and lake side samples, the sampling conditions are not homogenous and the results differ both in magnitude of pcs/m and the variety of objects found, see IQAASL -lakes and rivers and compare the median pcs/m in the national results.
River and lake samples can be tested togethor
River and lake samples can be tested separately
The distance and length parameters can be aggregated
average distance to intersection per location
total river network length in each buffer per location
2.2.1. Lake surveys#
As illustrated above some locations have mulitple intersection within the 1500 m buffer and some have none. Lake locations that have no intersections within the buffer are given a distance of 0 and length of 0. The class and size are both 20, indicating the smallest class and river size possible (example below). The name of the river intersection is given, in the case that there are no intersections within a 1500 m buffer then name=0. Removing the records with name=0 eliminates all lake records with no intersection data. However, for rivers the intersection name = the name of the feature that was sampled.
| loc_date | location | river_bassin | feature | city | w_t | code | pcs_m | quantity | name | size | class | distance | length | |
|---|---|---|---|---|---|---|---|---|---|---|---|---|---|---|
| 108961 | ('versoix', '2020-10-13') | versoix | rhone | lac-leman | Versoix | l | Gfrags | 0.68 | 35.00 | 0 | 20.00 | 20.00 | 0.00 | 0.00 |
2.2.2. River surveys#
The intersection of one river to another was not considered. Therefore, for river surveys the measured parameter is the length of the river in the buffer that was sampled. The class and size are set to 20 and the distance to intersection is 0. River sample locations, for this analysis, are considered the same as a lake locations with no corresponding intersections.
| loc_date | location | river_bassin | feature | city | w_t | code | pcs_m | quantity | name | size | class | distance | length | |
|---|---|---|---|---|---|---|---|---|---|---|---|---|---|---|
| 71862 | ('schusspark-strand', '2020-08-08') | schusspark-strand | aare | schuss | Biel/Bienne | r | Gfrags | 0.06 | 3.00 | La Suze | 20.00 | 20.00 | 0.00 | 3248.00 |
2.2.3. Description of the survey results#
Show code cell source
## The survey results
locations = df.location.unique()
samples = df.loc_date.unique()
lakes = df[df.w_t == "l"].drop_duplicates("loc_date").w_t.value_counts().values[0]
rivers = df[df.w_t == "r"].drop_duplicates("loc_date").w_t.value_counts().values[0]
codes_identified = df[df.quantity > 0].code.unique()
codes_possible = df.code.unique()
total_id = df.quantity.sum()

data_summary = {
    "n locations": len(locations),
    "n samples": len(samples),
    "n lake samples": lakes,
    "n river samples": rivers,
    "n identified object types": len(codes_identified),
    "n possible object types": len(codes_possible),
    "total number of objects": total_id
}

survey_desc = pd.DataFrame(index = data_summary.keys(), data=data_summary.values(), columns=["total"])
survey_desc.style.set_table_styles(table_css_styles)
| total | |
|---|---|
| n locations | 128 |
| n samples | 349 |
| n lake samples | 300 |
| n river samples | 49 |
| n identified object types | 191 |
| n possible object types | 211 |
| total number of objects | 46832 |
2.2.4. River and lake samples#
The survey resutls for both river and lakes are tested for correlation. Each intersection is tested once. Consider the example from St. Gingolph under this model each results is tested against the distance and length of each intersection for each location, this includes the size and the class.
River and lake samples not aggregated
Show code cell source
# the columns being tested against pcs_m
columns = ["distance", "length", "size", "class"]

# conduct the test
corellation_results = collectCorrelation(data, codes, columns)
crp = pd.DataFrame(corellation_results)
pvals = crp.pivot(index="code", columns="variable", values="p")
rhovals = crp.pivot(index="code", columns="variable", values="rho")

# display the results
a_df = pd.DataFrame(resultsDf(rhovals, pvals))
a_df["item"] = a_df.index.map(lambda x: code_d_map.loc[x])
a_df.set_index("item", inplace=True, drop=True)
a_df.index.name = None
a_df.style.format(precision=2).set_table_styles(table_css_styles)
| variable | class | distance | length | size |
|---|---|---|---|---|
| Food containers single use foamed or plastic | -0.14 | 0.19 | -0.11 | -0.11 |
| Clothing, towels & rags | 0.00 | 0.00 | 0.09 | 0.00 |
| Paper packaging | 0.00 | 0.00 | 0.00 | 0.00 |
| Fireworks paper tubes and fragments | 0.00 | 0.00 | 0.00 | 0.00 |
| Foil wrappers, aluminum foil | -0.23 | 0.00 | 0.00 | -0.26 |
| Metal bottle caps, lids & pull tabs from cans | -0.11 | 0.10 | 0.00 | -0.14 |
| Glass drink bottles, pieces | 0.00 | 0.00 | 0.00 | 0.00 |
| Construction material; bricks, pipes, cement | 0.00 | 0.00 | 0.00 | 0.00 |
| Glass or ceramic fragments > 2.5 cm | 0.00 | 0.00 | 0.00 | 0.00 |
| Drink lids | -0.13 | 0.20 | 0.00 | -0.10 |
| Lids for chemicals, detergents (non-food) | -0.15 | 0.13 | -0.10 | -0.13 |
| Lids unidentified | -0.14 | 0.21 | -0.08 | -0.11 |
| Lid/cap rings from plastic bottles/containers | -0.15 | 0.20 | 0.00 | -0.13 |
| Tobacco; plastic packaging, containers | -0.19 | 0.22 | 0.00 | -0.18 |
| Cigarette filters | -0.21 | 0.15 | 0.00 | -0.25 |
| Bags; plastic shopping/carrier/grocery and pieces | 0.00 | 0.09 | 0.00 | 0.00 |
| Food wrappers; candy, snacks | -0.24 | 0.23 | 0.00 | -0.24 |
| Coverings; plastic packaging, sheeting for protecting large cargo items | 0.00 | 0.00 | 0.00 | 0.00 |
| Industrial sheeting | -0.24 | 0.18 | 0.00 | -0.20 |
| Shotgun cartridges | -0.11 | 0.15 | -0.09 | 0.00 |
| Foamed items & pieces (non packaging/insulation) foamed sponge material | -0.12 | 0.14 | 0.00 | -0.13 |
| Foam packaging/insulation/polyurethane | -0.25 | 0.25 | 0.00 | -0.24 |
| Plastic construction waste | -0.15 | 0.16 | -0.08 | -0.14 |
| Fireworks; rocket caps, exploded parts & packaging | -0.12 | 0.10 | -0.09 | 0.00 |
| Ceramic tile and pieces | 0.09 | 0.09 | 0.00 | 0.00 |
| Labels, bar codes | -0.15 | 0.12 | 0.00 | -0.12 |
| Tissue, toilet paper, napkins, paper towels | 0.00 | 0.00 | 0.00 | 0.00 |
| Ribbons and bows | -0.10 | 0.00 | 0.00 | -0.10 |
| Foamed EVA (flexible plastic) for crafts & watersports | -0.14 | 0.00 | 0.00 | -0.14 |
| Packaging films nonfood or unknown | -0.16 | 0.00 | 0.00 | -0.13 |
| Pellet mass from injection molding | 0.00 | 0.00 | 0.00 | 0.00 |
| Cotton bud/swab sticks | -0.25 | 0.23 | 0.00 | -0.21 |
| Sanitary pads /panty liners/tampons and applicators | 0.00 | 0.00 | 0.00 | 0.00 |
| Diapers - wipes | 0.00 | 0.00 | 0.15 | 0.00 |
| Expanded polystyrene | -0.23 | 0.22 | -0.10 | -0.21 |
| Fragmented plastics | -0.26 | 0.20 | -0.09 | -0.23 |
2.2.4.1. The number of correlations#
| variable | class | distance | length | size | total |
|---|---|---|---|---|---|
| correlated | 24 | 21 | 10 | 21 | 76 |
| positive | 1 | 21 | 2 | 0 | 24 |
| negative | 23 | 0 | 8 | 21 | 52 |
Notes:
inverse correlations The size and class rankings start at zero, zero is the biggest. As an example the Aare and Rhône rivers are class 4. The correlations (if there are any) should be interpreted as 1/x:
If the correlation is negative: the density is greater as the size get bigger or the river is more important
If the correlation is positive: the density is greater as the size gets smaller of the river is less important
Therefore, objects that are positively correlated with size and class were found more often at the intersects of smaller and less important rivers.
Lake samples
The survey results for lakes are tested for correlation, river samples are excluded. Each intersection is tested once. The same as the previous model.
Show code cell source
datax = data[data.w_t == "l"]
columns = ["distance", "length", "size", "class"]
corellation_results = collectCorrelation(datax, codes, columns)
crp = pd.DataFrame(corellation_results)
pvals = crp.pivot(index="code", columns="variable", values="p")
rhovals = crp.pivot(index="code", columns="variable", values="rho")

# display the results
a_df = pd.DataFrame(resultsDf(rhovals, pvals))
a_df["item"] = a_df.index.map(lambda x: code_d_map.loc[x])
a_df.set_index("item", inplace=True, drop=True)
a_df.index.name = None
a_df.style.format(precision=2).set_table_styles(table_css_styles)
| variable | class | distance | length | size |
|---|---|---|---|---|
| Food containers single use foamed or plastic | 0.00 | 0.11 | 0.00 | 0.00 |
| Clothing, towels & rags | 0.00 | 0.00 | 0.00 | 0.00 |
| Paper packaging | 0.00 | 0.00 | 0.00 | 0.00 |
| Fireworks paper tubes and fragments | 0.00 | 0.00 | 0.00 | 0.00 |
| Foil wrappers, aluminum foil | -0.19 | 0.00 | 0.09 | -0.23 |
| Metal bottle caps, lids & pull tabs from cans | 0.00 | 0.00 | 0.11 | -0.11 |
| Glass drink bottles, pieces | 0.12 | -0.13 | 0.11 | 0.00 |
| Construction material; bricks, pipes, cement | 0.09 | 0.00 | 0.00 | 0.09 |
| Glass or ceramic fragments > 2.5 cm | 0.00 | 0.00 | 0.00 | 0.00 |
| Drink lids | 0.00 | 0.13 | 0.00 | 0.00 |
| Lids for chemicals, detergents (non-food) | -0.09 | 0.00 | 0.00 | 0.00 |
| Lids unidentified | 0.00 | 0.12 | 0.00 | 0.00 |
| Lid/cap rings from plastic bottles/containers | 0.00 | 0.12 | 0.00 | 0.00 |
| Tobacco; plastic packaging, containers | -0.09 | 0.13 | 0.00 | 0.00 |
| Cigarette filters | -0.13 | 0.00 | 0.17 | -0.18 |
| Bags; plastic shopping/carrier/grocery and pieces | 0.00 | 0.10 | 0.00 | 0.00 |
| Food wrappers; candy, snacks | -0.12 | 0.11 | 0.12 | -0.12 |
| Coverings; plastic packaging, sheeting for protecting large cargo items | 0.00 | 0.00 | 0.00 | 0.00 |
| Industrial sheeting | -0.16 | 0.09 | 0.14 | -0.12 |
| Shotgun cartridges | 0.00 | 0.09 | 0.00 | 0.00 |
| Foamed items & pieces (non packaging/insulation) foamed sponge material | 0.00 | 0.09 | 0.00 | -0.09 |
| Foam packaging/insulation/polyurethane | -0.13 | 0.14 | 0.09 | -0.12 |
| Plastic construction waste | 0.00 | 0.00 | 0.00 | 0.00 |
| Fireworks; rocket caps, exploded parts & packaging | 0.00 | 0.00 | 0.00 | 0.00 |
| Ceramic tile and pieces | 0.17 | 0.00 | 0.00 | 0.00 |
| Labels, bar codes | -0.11 | 0.00 | 0.00 | 0.00 |
| Tissue, toilet paper, napkins, paper towels | 0.00 | 0.00 | 0.00 | 0.00 |
| Ribbons and bows | 0.00 | 0.00 | 0.00 | 0.00 |
| Foamed EVA (flexible plastic) for crafts & watersports | -0.11 | 0.00 | 0.00 | -0.10 |
| Packaging films nonfood or unknown | -0.13 | 0.00 | 0.00 | -0.10 |
| Pellet mass from injection molding | 0.00 | 0.00 | 0.00 | 0.00 |
| Cotton bud/swab sticks | -0.12 | 0.10 | 0.11 | 0.00 |
| Sanitary pads /panty liners/tampons and applicators | 0.00 | 0.00 | 0.13 | 0.00 |
| Diapers - wipes | 0.00 | 0.00 | 0.18 | -0.10 |
| Expanded polystyrene | 0.00 | 0.00 | 0.00 | 0.00 |
| Fragmented plastics | -0.10 | 0.00 | 0.10 | 0.00 |
2.2.4.2. The number of correlations#
| variable | class | distance | length | size | total |
|---|---|---|---|---|---|
| correlated | 15 | 13 | 11 | 11 | 50 |
| positive | 3 | 12 | 11 | 1 | 27 |
| negative | 12 | 1 | 0 | 10 | 23 |
2.2.5. Aggregated intersection and length#
The length and distance parameters are aggregated in the following way:
length: the sum of the length of all intersections in the buffer
distance: the average distance to an intersection
Because we are aggregating, the size and class values for each intersection are not considered. The example for St. Gingolph is below.
| loc_date | location | river_bassin | feature | city | w_t | code | pcs_m | quantity | distance | length | |
|---|---|---|---|---|---|---|---|---|---|---|---|
| 17351 | ('grand-clos', '2020-05-07') | grand-clos | rhone | lac-leman | Saint-Gingolph | l | Gfrags | 2.56 | 82 | 1039.92 | 1995.34 |
River and lake samples aggregated
Show code cell source
columns = ["distance", "length"]

corellation_results = collectCorrelation(data, codes, columns)
crp = pd.DataFrame(corellation_results)
pvals = crp.pivot(index="code", columns="variable", values="p")
rhovals = crp.pivot(index="code", columns="variable", values="rho")

# display the results
a_df = pd.DataFrame(resultsDf(rhovals, pvals))
a_df["item"] = a_df.index.map(lambda x: code_d_map.loc[x])
a_df.set_index("item", inplace=True, drop=True)
a_df.index.name = None
a_df.style.format(precision=2).set_table_styles(table_css_styles)
| variable | distance | length |
|---|---|---|
| Food containers single use foamed or plastic | 0.21 | 0.00 |
| Clothing, towels & rags | 0.00 | 0.00 |
| Paper packaging | 0.00 | 0.00 |
| Fireworks paper tubes and fragments | 0.00 | 0.00 |
| Foil wrappers, aluminum foil | 0.11 | 0.00 |
| Metal bottle caps, lids & pull tabs from cans | 0.19 | 0.00 |
| Glass drink bottles, pieces | 0.00 | 0.00 |
| Construction material; bricks, pipes, cement | 0.00 | 0.00 |
| Glass or ceramic fragments > 2.5 cm | 0.00 | -0.11 |
| Drink lids | 0.22 | 0.00 |
| Lids for chemicals, detergents (non-food) | 0.14 | 0.00 |
| Lids unidentified | 0.23 | 0.00 |
| Lid/cap rings from plastic bottles/containers | 0.25 | 0.00 |
| Tobacco; plastic packaging, containers | 0.29 | 0.00 |
| Cigarette filters | 0.24 | 0.00 |
| Bags; plastic shopping/carrier/grocery and pieces | 0.00 | 0.21 |
| Food wrappers; candy, snacks | 0.30 | 0.00 |
| Coverings; plastic packaging, sheeting for protecting large cargo items | 0.00 | 0.00 |
| Industrial sheeting | 0.17 | 0.17 |
| Shotgun cartridges | 0.14 | 0.00 |
| Foamed items & pieces (non packaging/insulation) foamed sponge material | 0.18 | 0.00 |
| Foam packaging/insulation/polyurethane | 0.29 | 0.00 |
| Plastic construction waste | 0.16 | 0.00 |
| Fireworks; rocket caps, exploded parts & packaging | 0.00 | 0.00 |
| Ceramic tile and pieces | 0.15 | 0.00 |
| Labels, bar codes | 0.13 | 0.00 |
| Tissue, toilet paper, napkins, paper towels | 0.13 | 0.00 |
| Ribbons and bows | 0.00 | 0.00 |
| Foamed EVA (flexible plastic) for crafts & watersports | 0.00 | 0.00 |
| Packaging films nonfood or unknown | 0.00 | 0.00 |
| Pellet mass from injection molding | 0.00 | 0.14 |
| Cotton bud/swab sticks | 0.27 | 0.00 |
| Sanitary pads /panty liners/tampons and applicators | 0.00 | 0.00 |
| Diapers - wipes | 0.00 | 0.00 |
| Expanded polystyrene | 0.24 | 0.00 |
| Fragmented plastics | 0.24 | 0.00 |
2.2.5.1. The number of correlations#
| variable | distance | length | total |
|---|---|---|---|
| correlated | 21 | 4 | 25 |
| positive | 21 | 3 | 24 |
| negative | 0 | 1 | 1 |
Lake samples aggregated
Show code cell source
datax = data[data.w_t == 'l']
corellation_results = collectCorrelation(datax, codes, columns)
crp = pd.DataFrame(corellation_results)
pvals = crp.pivot(index="code", columns="variable", values="p")
rhovals = crp.pivot(index="code", columns="variable", values="rho")

# display the results
a_df = pd.DataFrame(resultsDf(rhovals, pvals))
a_df["item"] = a_df.index.map(lambda x: code_d_map.loc[x])
a_df.set_index("item", inplace=True, drop=True)
a_df.index.name = None
a_df.style.format(precision=2).set_table_styles(table_css_styles)
| variable | distance | length |
|---|---|---|
| Food containers single use foamed or plastic | 0.12 | 0.14 |
| Clothing, towels & rags | 0.00 | 0.00 |
| Paper packaging | 0.00 | 0.00 |
| Fireworks paper tubes and fragments | 0.00 | 0.00 |
| Foil wrappers, aluminum foil | 0.00 | 0.18 |
| Metal bottle caps, lids & pull tabs from cans | 0.13 | 0.00 |
| Glass drink bottles, pieces | -0.20 | 0.00 |
| Construction material; bricks, pipes, cement | 0.00 | 0.00 |
| Glass or ceramic fragments > 2.5 cm | 0.00 | -0.09 |
| Drink lids | 0.13 | 0.23 |
| Lids for chemicals, detergents (non-food) | 0.00 | 0.17 |
| Lids unidentified | 0.12 | 0.18 |
| Lid/cap rings from plastic bottles/containers | 0.13 | 0.13 |
| Tobacco; plastic packaging, containers | 0.17 | 0.16 |
| Cigarette filters | 0.00 | 0.18 |
| Bags; plastic shopping/carrier/grocery and pieces | 0.00 | 0.23 |
| Food wrappers; candy, snacks | 0.14 | 0.27 |
| Coverings; plastic packaging, sheeting for protecting large cargo items | 0.00 | 0.00 |
| Industrial sheeting | 0.00 | 0.34 |
| Shotgun cartridges | 0.00 | 0.17 |
| Foamed items & pieces (non packaging/insulation) foamed sponge material | 0.13 | 0.00 |
| Foam packaging/insulation/polyurethane | 0.14 | 0.26 |
| Plastic construction waste | 0.00 | 0.15 |
| Fireworks; rocket caps, exploded parts & packaging | 0.00 | 0.00 |
| Ceramic tile and pieces | 0.00 | 0.00 |
| Labels, bar codes | 0.00 | 0.00 |
| Tissue, toilet paper, napkins, paper towels | 0.13 | 0.00 |
| Ribbons and bows | 0.00 | 0.00 |
| Foamed EVA (flexible plastic) for crafts & watersports | 0.00 | 0.13 |
| Packaging films nonfood or unknown | 0.00 | 0.13 |
| Pellet mass from injection molding | 0.00 | 0.16 |
| Cotton bud/swab sticks | 0.00 | 0.30 |
| Sanitary pads /panty liners/tampons and applicators | 0.00 | 0.13 |
| Diapers - wipes | 0.00 | 0.14 |
| Expanded polystyrene | 0.00 | 0.26 |
| Fragmented plastics | 0.00 | 0.25 |
2.2.5.2. The number of correlations#
| variable | distance | length | total |
|---|---|---|---|
| correlated | 11 | 23 | 34 |
| positive | 10 | 22 | 32 |
| negative | 1 | 1 | 2 |
This script updated 08/08/2023 in Biel, CH
❤️ what you do everyday
analyst at hammerdirt
Git repo: https://github.com/hammerdirt-analyst/landuse.git

Git branch: main

PIL    : 9.5.0
pandas : 2.0.0
numpy  : 1.24.2
IPython: 8.12.0
scipy  : 1.10.1