3. Plastic shotgun shell wadding#
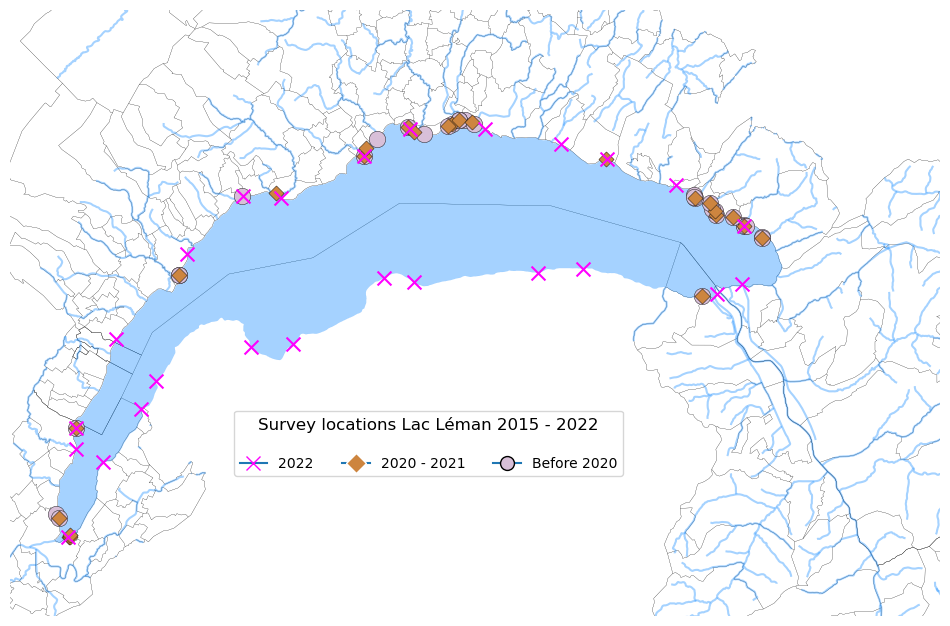
A summary of observations on Lac Léman
Plastic wadding is commonly used in modern shotgun shells due to its durability and consistency in performance. It helps to cushion the shot or slug as it moves down the barrel, ensuring it stays centered and providing a proper seal to maximize the energy transfer upon firing.
Plastic wadding can come in various forms, such as wads or cups, and they can have different designs depending on the specific requirements of the shotgun shell and the desired performance characteristics.
When plastic wadding is left behind after shooting activities or improperly disposed of, it can find its way into water bodies and eventually wash up on beaches. Once there, it can pose risks to wildlife through ingestion or entanglement.
3.1. Sampling campaigns 2015 - 2022#
Plastic shotgun wadding has been identified in every major sampling campaign in the Léman region since monitoring of plastics began.
Montreux Clean Beach Project (MCBP): November 2015 - November 2016. Sampling campaign by local organization
Swiss Litter Report (SLR): April 2017 - May 2018. Sampling campaign by the WWF Switzerland.
Identification Qauntitification of Anthropogenc Litter Switzerlnd (IQAASL): April 2020 - May 2021. Sampling campaign mandated by the Swiss confederation.
Pla’stock: January 2022 - December 2022. Sampling campaign by Association pour la Sauvegard du Léman.
3.1.1. Essential statistics: 2015 - 2021#
From 2015-11-23 to 2021-11-14 a total of 949 plastic waddings (PW) were found in 250 separate samples. The samples were from 38 different locations, representing 15 different municipalities and three cantons. PW were indentified in 54% of samples. The average number found per sample was 3, the median contamination per meter of shoreline was 0.02. Which means that we found at leat 1 PW for every two trips to the beach and it was not uncommon to find more.
On a per meter basis (pcs/m) we found on average 0.1 PW for every meter. Values in excess of 50 PW per 100 meters were encountered less than 5% of the time.
3.1.2. Essential statistics: 2022#
In 2022, contrary to the previous sampling campaigns, the french side of the lake was also sampled according to same protocol as the previous years.
From 2022-01-10 to 2022-12-17 a total of 199 plastic waddings (PW) were found in 98 separate samples. The samples were from 25 different locations, representing 15 different municipalities and three cantons. PW were indentified in 38% of samples. The average number found per sample was 2, the median found was 0.0. Which means that for any given visit to the shoreline on Lake Geneva we found at leat 1 PW 50% of the time and it was not uncommon to find more.
On a per meter basis (pcs/m) we found on average 0.02 PW for every meter. The mediam was 0 PW/meter. Values in excess of 50 PW per 100 meters were encountered less than 5% of the time.
3.1.3. Cumulative results at a glance#
In total (both periods combined) there were 348 samples from 39 cities between 2015 - 2022 that yielded 1148 PWs. The average PW per meter was 0.08 and the median was 0.004 PW per meter with a standard deviation of 0.21
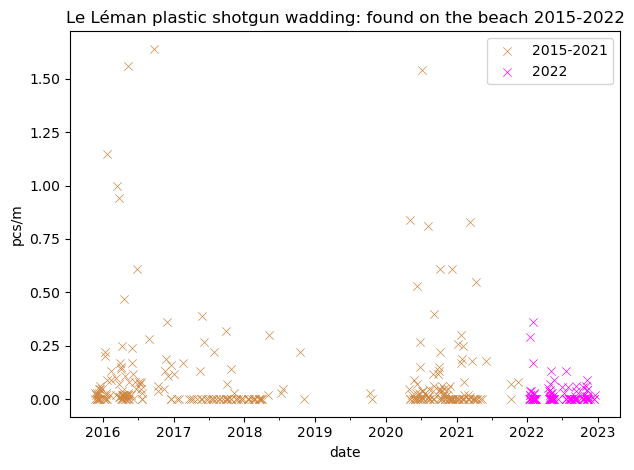
The number of plastic shotgun wadding per meter 2015 - 2022
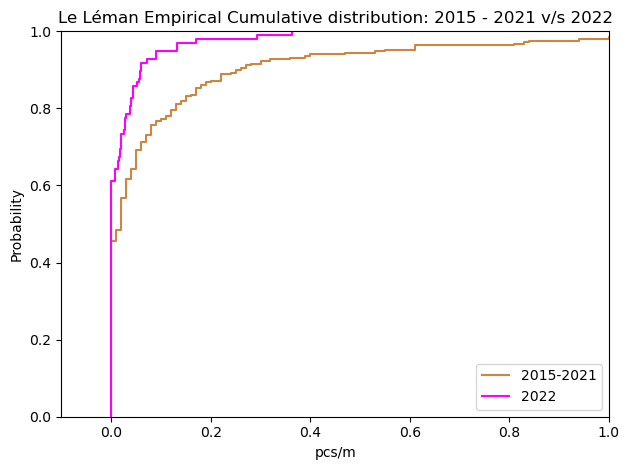
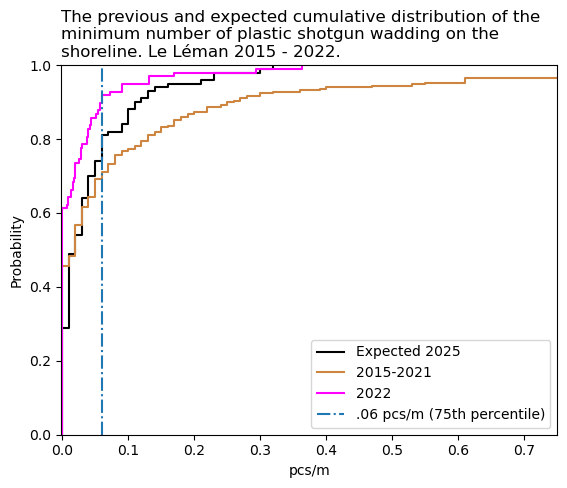
The cumulative distribution of the number of plastic wadding per meter 2015 - 2021 v/s 2022
3.1.4. Municipal results#
Municipal results 2015 - 2021
Nummber of cities with two or more samples where none were found: 0
Cities where none were found, for all cities and number of samples: Morges, Rolle
| pcs/m | quantity | nsamples | |
|---|---|---|---|
| Saint-Gingolph | 0.68 | 268 | 13 |
| Allaman | 0.14 | 12 | 3 |
| Bourg-en-Lavaux | 0.12 | 3 | 2 |
| La Tour-de-Peilz | 0.12 | 102 | 25 |
| Montreux | 0.11 | 267 | 53 |
| Vevey | 0.11 | 190 | 44 |
| Saint-Sulpice (VD) | 0.06 | 34 | 15 |
| Versoix | 0.05 | 26 | 4 |
| Genève | 0.03 | 34 | 29 |
| Préverenges | 0.01 | 8 | 15 |
| Tolochenaz | 0.01 | 2 | 3 |
| Lausanne | 0.01 | 1 | 20 |
| Gland | 0.00 | 2 | 22 |
| Morges | 0.00 | 0 | 1 |
| Rolle | 0.00 | 0 | 1 |
Municipal results 2022
Nummber of cities with two or more samples where none were found: 10
Cities where none were found, for all cities and number of samples: Anthy, Aubonne, Crans, Cully, Gland, Hermance, Meillerie, Rolle, Tolochenaz, Tougues
| pcs/m | quantity | nsamples | |
|---|---|---|---|
| Amphion | 0.17 | 62 | 4 |
| Bouveret | 0.10 | 46 | 4 |
| Saint-Disdille | 0.07 | 27 | 4 |
| Lutry | 0.05 | 14 | 4 |
| Lugrin | 0.03 | 9 | 4 |
| Grangettes | 0.03 | 8 | 4 |
| Clarens | 0.03 | 6 | 4 |
| Savonière | 0.02 | 5 | 4 |
| Vidy | 0.02 | 6 | 4 |
| Versoix | 0.01 | 7 | 8 |
| Genève | 0.01 | 3 | 4 |
| Vevey | 0.01 | 1 | 4 |
| Préverenges | 0.01 | 3 | 4 |
| Excenevex | 0.00 | 2 | 4 |
| Aubonne | 0.00 | 0 | 4 |
| Tougues | 0.00 | 0 | 4 |
| Tolochenaz | 0.00 | 0 | 4 |
| Crans | 0.00 | 0 | 3 |
| Rolle | 0.00 | 0 | 3 |
| Cully | 0.00 | 0 | 4 |
| Anthy | 0.00 | 0 | 4 |
| Hermance | 0.00 | 0 | 4 |
| Gland | 0.00 | 0 | 4 |
| Meillerie | 0.00 | 0 | 4 |
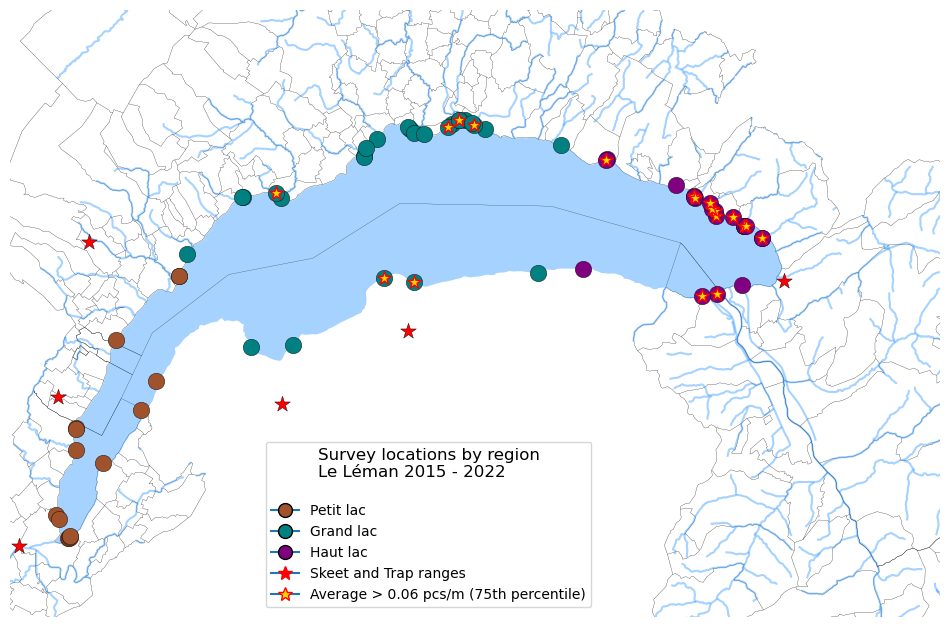
3.2. Regional results#
Lake Geneva is divided into three parts because of its different types of formation (sedimentation, tectonic folding, glacial erosion):
Haut Lac (‘Upper Lake’), the eastern part from the Rhône estuary to the line of Meillerie–Rivaz
Grand Lac (‘Large Lake’), the largest and deepest basin with the lake’s largest width
Petit Lac (‘Small Lake’), the most south-west, narrower and less deep part from Yvoire–Promenthoux next Prangins to the exit in Geneva
For a brief description of the geography of Lac Léman see: Wikepedia Lake Geneva
Average PW per meter 2015 - 2021
| region | pcs/m |
|---|---|
| Grand lac | 0.03 |
| Haut lac | 0.17 |
| Petit lac | 0.02 |
The regional results mirror the results by time frame, that is in general we found less PW in 2022 than the previous years. However, whether you sampled in 2022 or 2021, the average values were higher in the Grand and Haut lac as opposed to the Petit lac.
Average PW per meter 2022
| region | pcs/m |
|---|---|
| Grand lac | 0.03 |
| Haut lac | 0.03 |
| Petit lac | 0.01 |
3.2.1. Where did we find the most ?#
The 75th percentile of all the samples is 0.06 pcs/m or 6 PW for every 100m. The map below shows the locations where the average number per meter exceeded 0.06 pcs/m.
3.3. Predictions for 2025#
According to the anlysis done by the Association pour la Sauvegarde du Léman predictions 2025 we expect the average to increase across all regions, however the median value is expected to be between 0.02 and 0.03 PW for every meter. That is we expect to find at least one PW for every two trips to the shoreline. The highest values are expected to be in the Haut lac.
The predicted distribution is a grid approximation for the sequence of values that covers the range 0 - 20 every 0.01 or more precisely:
In the case where \(N=20\) and assume we collect 100 samples in 2025 the expected median is .02 and the 75th is 0.04. The same as the ASL study. The predicted average under this model is 0.04, different than the model used in the ASL study because in this case we have limited the max grid.
3.3.1. Discussion#
In general there should be fewer extreme incidents. However, the municipal results suggest that there are areas of higher concentration. Similarities may exist between these locations that help indicate the point source. In the case of Port Valais and Saint-Gongolph it is unlikely that the ball-trap range in proximity is the soul probable source. The stockalper canal runs through Port Valais, parallel to the Rhône with origins in Monthey, the stockalper canal has an important flow rate and can transport objects of all sizes.
Most important is the consensus on the frequency of occurence (the probability of finding at least one) return your attention to Saint Gingolph and Port Valais, they are co-located geographically and they were sampled in different years but the results are similar. In Préverenges and Vidy the same situation occurs.
3.4. References:#
3.5. Citizen science and data collection#
Guidance on Monitoring of Marine Litter in European Seas, Galgani et all, EUR 26113. Luxembourg (Luxembourg): Publications Office of the European Union; 2013. JRC83985 https://publications.jrc.ec.europa. eu/repository/handle/JRC83985
Guidance on the Monitoring of Marine Litter in European Seas An update to improve the harmonised monitoring of marine litter under the Marine Strategy Framework Directive, Galgani et all., EUR 31539 EN, Publications Office of the European Union, Luxembourg, 2023, ISBN 978-92- 68-04093-5, doi:10.2760/59137, JRC133594 https://literatur.thuenen.de/digbib_extern/dn067364.pdf
A European threshold value and assessment method for macro litter on coastlines, Publications Office of the European Union, Van Loon, et all , https://publications.jrc.ec.europa.eu/repository/handle/JRC121707, ISBN 978-92-76-21444-1, doi:10.2760/54369, JRC121707.
Improving big citizen science data: Moving beyond haphazard sampling, Amano, Tatsuya and Lamming, Jonathan D. L. and Sutherland, William J, PLoS Biology, 2016, doi: 10.1371/journal.pbio.1002413, url: https://journals.plos.org/plosbiology/article?id=10.1371/journal.pbio.1002413.
Pla’stock : Rapport Final, plastic stocks on Lake Geneva, Switzerland. Association pour la Sauvegarde de Léman, plastock
Identification, quantification and analysis of observable anthropogenic litter along Swiss lake systems, OFEV. 2021. IQAASL
Swiss Litter Report, Gabrielle, Kuhl; Pascal, Blahrer; 2018; Stopp research
3.6. Computing and mathematics#
scipy: Fundamental Algorithms for Scientific Computing in Python, Virtanen et al, Nature Methods, 2020, doi: 10.1038/s41592-019-0686-2.
pandas, The pandas development team, Python software, 2020, doi: 10.5281/zenodo.3509134, url: https://doi.org/10.5281/zenodo.3509134.
Python 3 Reference Manual, Guido Van Rossum and Fred L. Drake, CreateSpace, 2009, isbn: 1441412697.
Bayesian Data Analysis - Third edition, Andrew Gelman, Columbia university, 2021, http://www.stat.columbia.edu/~gelman/book/BDA3.pdf, doi: 10.1201/b16018.
Think Bayes 2ed, Alan Downey, Green Tea Press, 2021, http://allendowney.github.io/ThinkBayes2/
Regression analysis of count data. 2nd ed, A. Cameron and Pravin Trivedi, Technometrics, 1999, doi: 10.1017/CBO9780511814365.
Jupyter Book, Jupyter Book, 2021, https://zenodo.org/record/4539666.
Bayesian Methods for Hackers, Cameron Davidson-Pilon, Addison-Wesley Professional, 2021, https://github. com/CamDavidsonPilon/Probabilistic-Programming-and-Bayesian-Methods-for-Hackers, doi: 10.5555/2851115
Bayes Rules! An Introduction to Applied Bayesian Modeling, Alicia Johnson, Chapman and Hall, 2021, https://www.bayesrulesbook.com/chapter-1.html, isbn: 9780367255398.
scikit-learn: Machine Learning in python, Pedregosa et al, Journal of Machine Learning Research, 2011, doi: 10.1109/MCSE.2007.55.
Matplotlib: A 2D graphics environment, Hunter, J. D., Computing in Science & Engineering, 2007, doi: 10.1109/MCSE.2007.55.
Bayesian Analysis with Python - Second Edition, Martin Oswaldo, PackT, 2020, isbn: 9781789341652.
Probability Theory: The logic of science, Edwin Jaynes, Washington University, 2003, isbn: 0521592712.
Resampling, Wikepedia, 2021, https://en.wikipedia.org/wiki/Resampling_(statistics).
3.7. Annex#
All samples 2015 - 2022
number of samples : 348
number of cities: 39
number of locations: 63
total objects: 1148
fail rate: 0.5
average: 0.08
median: 0.0
2022
number of samples : 98
number of cities: 24
number of locations: 25
total objects: 199
fail rate: 0.39
average: 0.02
median: 0.0
2015 - 2021
f* number of samples : 250
number of cities: 15
number of locations: 38
total objects: 949
fail rate: 0.548
average: 0.10168
median: 0.02
This script updated 27/09/2024 in Biel, CH
❤️ what you do everyday: analyst at hammerdirt