7. 2016#
i = pd.read_csv("data/sampledata/with_normalized_count.csv")
i.head()
| date | location | replican | event | before event | after event | count | coef | per 100 | label | |
|---|---|---|---|---|---|---|---|---|---|---|
| 0 | 2016-07-05 | MRD | ('2016-07-05', 'MRD1') | True | False | False | 0.0 | 250 | 0.0 | Bioindicator |
| 1 | 2016-07-12 | MRD | ('2016-07-12', 'MRD1') | True | False | False | 22.0 | 25 | 550.0 | Bioindicator |
| 2 | 2016-07-19 | MRD | ('2016-07-19', 'MRD1') | False | False | True | 8.0 | 25 | 200.0 | Bioindicator |
| 3 | 2016-06-21 | MRD | ('2016-06-21', 'MRD1') | False | True | False | 2.0 | 100 | 200.0 | Bioindicator |
| 4 | 2016-06-28 | MRD | ('2016-06-28', 'MRD1') | False | True | False | 0.0 | 25 | 0.0 | Bioindicator |
i = pd.read_csv("data/sampledata/sample_results.csv")
rep_data
| date | location | sample | date_sample | event | before event | after event | medium | label | count | coef | week | doy | year | color | image | string_date | per/100ml | fail | |
|---|---|---|---|---|---|---|---|---|---|---|---|---|---|---|---|---|---|---|---|
| 0 | 2016-07-05 | MRD | MRD1 | ('2016-07-05', 'MRD1') | True | False | False | EasyGel | Bioindicator | 0.0 | 250 | 27 | 187 | 2016 | big_blue | none | 2016-07-05 | 0.0 | False |
| 1 | 2016-07-12 | MRD | MRD1 | ('2016-07-12', 'MRD1') | True | False | False | EasyGel | Bioindicator | 22.0 | 25 | 28 | 194 | 2016 | big_blue | none | 2016-07-12 | 550.0 | True |
| 2 | 2016-07-19 | MRD | MRD1 | ('2016-07-19', 'MRD1') | False | False | True | EasyGel | Bioindicator | 8.0 | 25 | 29 | 201 | 2016 | big_blue | none | 2016-07-19 | 200.0 | True |
| 3 | 2016-06-21 | MRD | MRD1 | ('2016-06-21', 'MRD1') | False | True | False | EasyGel | Bioindicator | 2.0 | 100 | 25 | 173 | 2016 | big_blue | none | 2016-06-21 | 200.0 | True |
| 4 | 2016-06-28 | MRD | MRD1 | ('2016-06-28', 'MRD1') | False | True | False | EasyGel | Bioindicator | 0.0 | 25 | 26 | 180 | 2016 | big_blue | none | 2016-06-28 | 0.0 | False |
| ... | ... | ... | ... | ... | ... | ... | ... | ... | ... | ... | ... | ... | ... | ... | ... | ... | ... | ... | ... |
| 379 | 2016-06-21 | VNX | VNX3 | ('2016-06-21', 'VNX3') | False | True | False | EasyGel | Other | 0.0 | 100 | 25 | 173 | 2016 | turq | none | 2016-06-21 | 0.0 | False |
| 380 | 2016-06-28 | VNX | VNX3 | ('2016-06-28', 'VNX3') | False | True | False | EasyGel | Other | 4.0 | 25 | 26 | 180 | 2016 | turq | none | 2016-06-28 | 100.0 | False |
| 381 | 2016-07-26 | VNX | VNX3 | ('2016-07-26', 'VNX3') | False | False | True | EasyGel | Other | 0.0 | 25 | 30 | 208 | 2016 | turq | none | 2016-07-26 | 0.0 | False |
| 382 | 2016-08-09 | VNX | VNX3 | ('2016-08-09', 'VNX3') | False | False | True | EasyGel | Other | 0.0 | 25 | 32 | 222 | 2016 | turq | none | 2016-08-09 | 0.0 | False |
| 383 | 2016-08-02 | VNX | VNX3 | ('2016-08-02', 'VNX3') | False | False | True | EasyGel | Other | 0.0 | 25 | 31 | 215 | 2016 | turq | none | 2016-08-02 | 0.0 | False |
384 rows × 19 columns
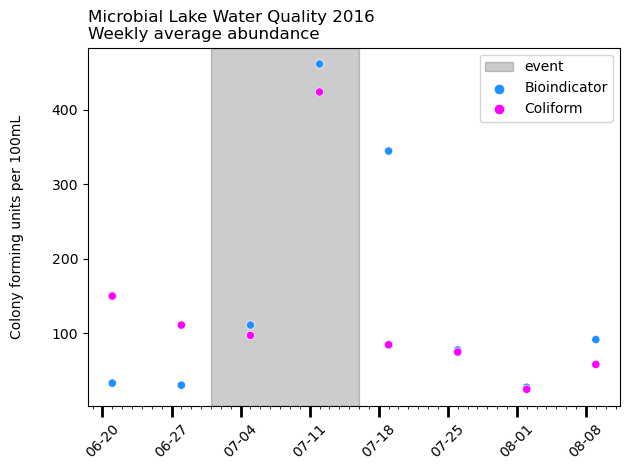
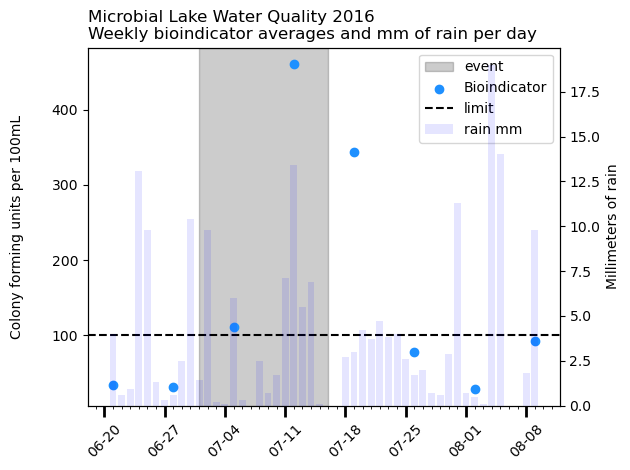
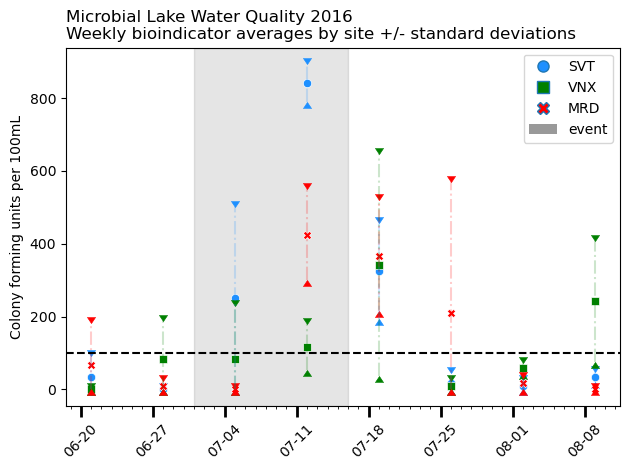
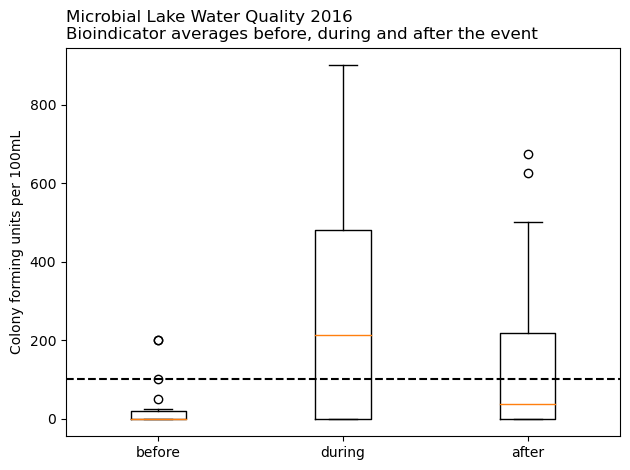
7.1. Are the weekly bioindicator averages during the event greater than before or after the event?#
This script updated 22/03/2024 in Ecublens, CH
❤️ what you do everyday: biolab at hackuarium
Git repo: https://github.com/hammerdirt/qualite-deau.git

Git branch: main

pandas    : 2.0.3
numpy     : 1.25.2
matplotlib: 3.7.1
seaborn   : 0.12.2